Gas prices have continued to steadily decline since hitting record highs in June 2022.
Some social media users have speculated the drop is the result of intentional maneuvering by politicians, hoping to give themselves a boost heading into the midterm elections.
“The closer we get to November 8th the cheaper gas gets,” read one Facebook comment. “Understand the connection.”
But is there really a connection?
THE QUESTION
Do gas prices always go down right before federal elections?
THE SOURCES
- U.S. Energy Information Administration
- U.S. Bureau of Labor Statistics
- Ed Hirs, Energy Fellow at the University of Houston
THE ANSWER
No, gas prices don’t always go down right before federal elections.
WHAT WE FOUND
The U.S Energy Information Administration keeps historical data on gas prices each week, going back to 1993.
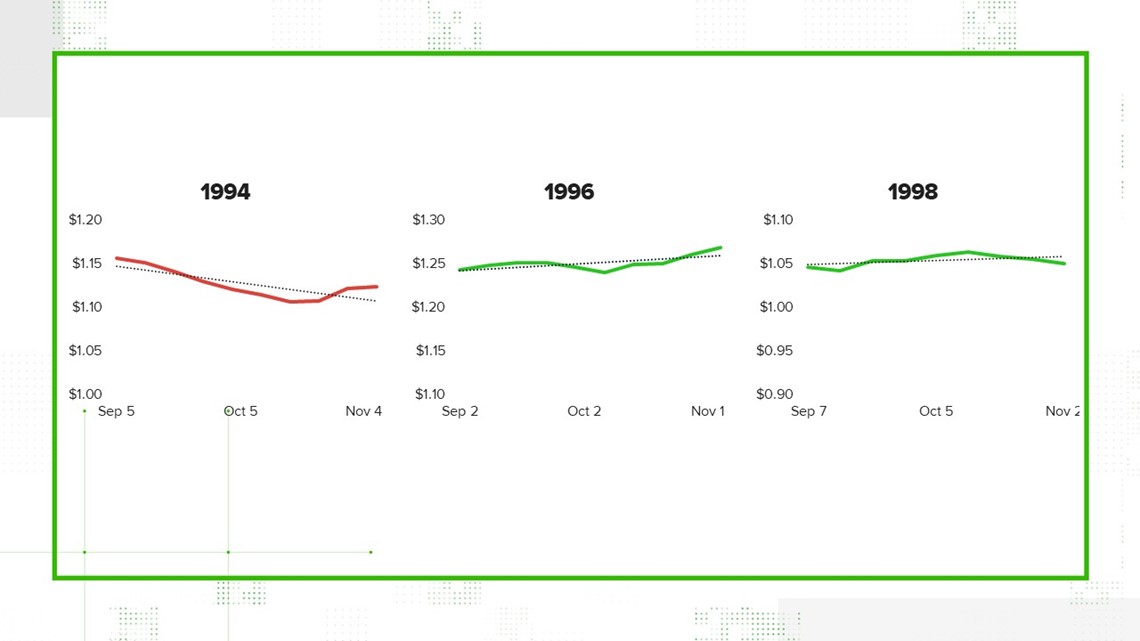
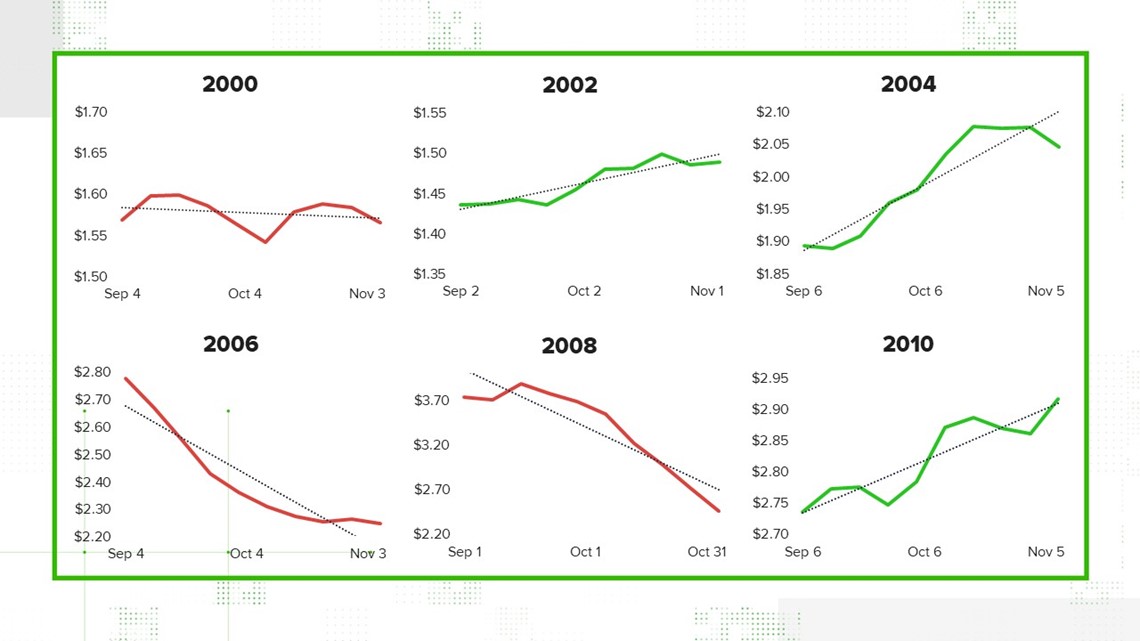
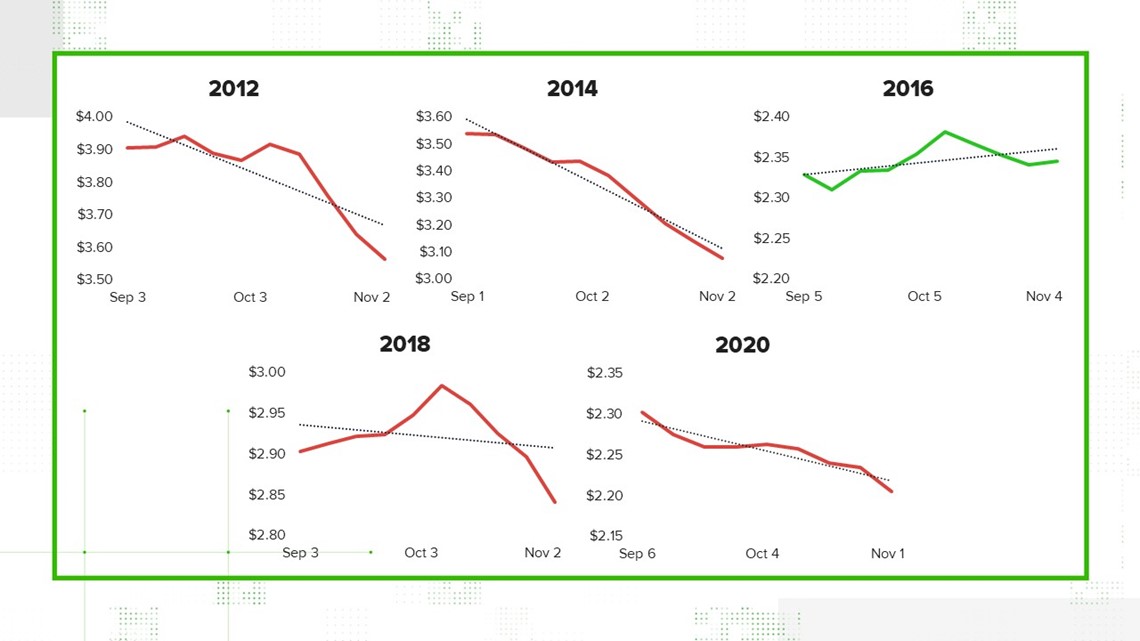
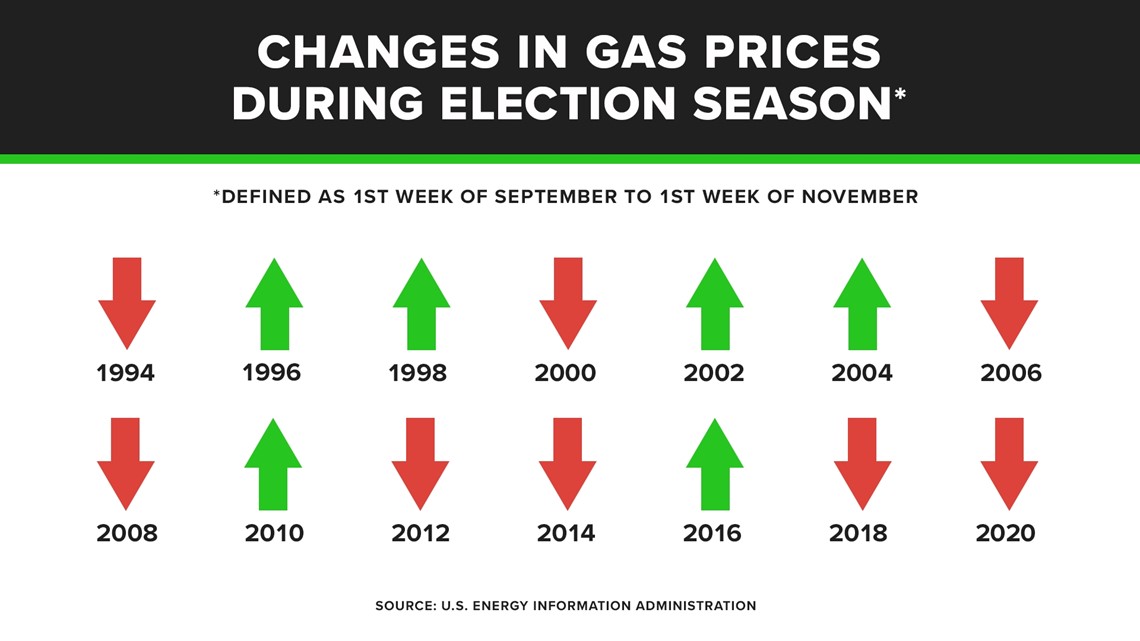
VERIFY examined that data, focusing solely on standard federal elections years, meaning even-numbered years. We further narrowed in on the two months leading up to general elections, since many of the comments speculating about imminent price decreases were posted in mid-September.
By graphing the weekly data in each election period, we can determine whether the overall trend was a price decrease or a price increase.
Of the 14 election seasons we analyzed from 1994 to 2020, prices decreased in eight of them. The other six saw price increases for gasoline. Meaning, there is no clear correlation between election seasons and gas prices, regardless of which political party was in power ahead of the election.
The U.S. Bureau of Labor Statistics also keeps monthly data on historic gas prices, dating to 1976. Because the data isn’t weekly, we can’t isolate election day, but we can get a broad idea of the trends by looking at data in the months of September, October, and November. Of those periods in the 23 election years covered by BLS data, gas prices decreased in 15 and increased in eight. So it is more common for prices to drop in the fall than to rise, but it hardly precedes every election cycle.
Energy economist Ed Hirs told VERIFY that gas prices can sometimes dip in the fall in part because that’s when stations transition away from more expensive, smog-resistant formulations that are needed only in the summer.
“We go to a less expensive formulation for winter gasoline,” he said. “There's [also] less demand in the wintertime. Give or take driving to school, you're not driving to vacation. And so for a couple of reasons, you might see some sort of dip in the wintertime.”
He says a number of other factors are at play for the current decline in prices. For one, Chinese demand is below normal levels because the country still has frequent COVID-19 lockdowns. In addition, the effects of the war in Ukraine have lessened as Russia finds ways to export its oil through countries that aren’t sanctioning it. The U.S. has also been dipping into its strategic petroleum reserve for about a year now, but Hirs says that usage hasn’t accelerated as the election approaches.
“No, the releases are very well planned. They're very well announced on the [Department of Energy] website,” said Hirs. “So there's nothing unusual going on there.”

Ultimately, there’s only so much the government can do to lower gas prices in the first place, given the numerous global market factors at play.
“The president is at the mercy of the market, because the United States has a perfectly open-border market with respect to crude oil and refined products,” said Hirs. “A consumer in Portland, a consumer in Houston, is competing with a consumer in Tokyo, or the consumer in Paris, to buy that marginal gallon of gasoline.”

